It is no secret, that I am very much an advocate for always using Calligraphy Grids. I’m known for being the kind of teacher that will always answer the question of when to graduate from guidelines with “never”.
Yes, there comes a time, where you will have so much muscle memory, that you’ll have a slant built into your script that is pretty consistent, but why rely on a pretty consistent, if we aim for very consistent? Guidelines are our friends and I will always write on a grid.
I believe the main reason why people don’t want to use grids is because they can be time-consuming and annoying to draw. But I have (at least partially) a solution for that.
Table of Contents
You Still Need a Great Ruler
You Still Need a Great RulerThere will always be cases, where you will need to pull out pencils and rulers and draw lines by hand. And, don’t get me wrong, I love my giant 30cm set square, but it’s not something I want to take out every time I want to practice.
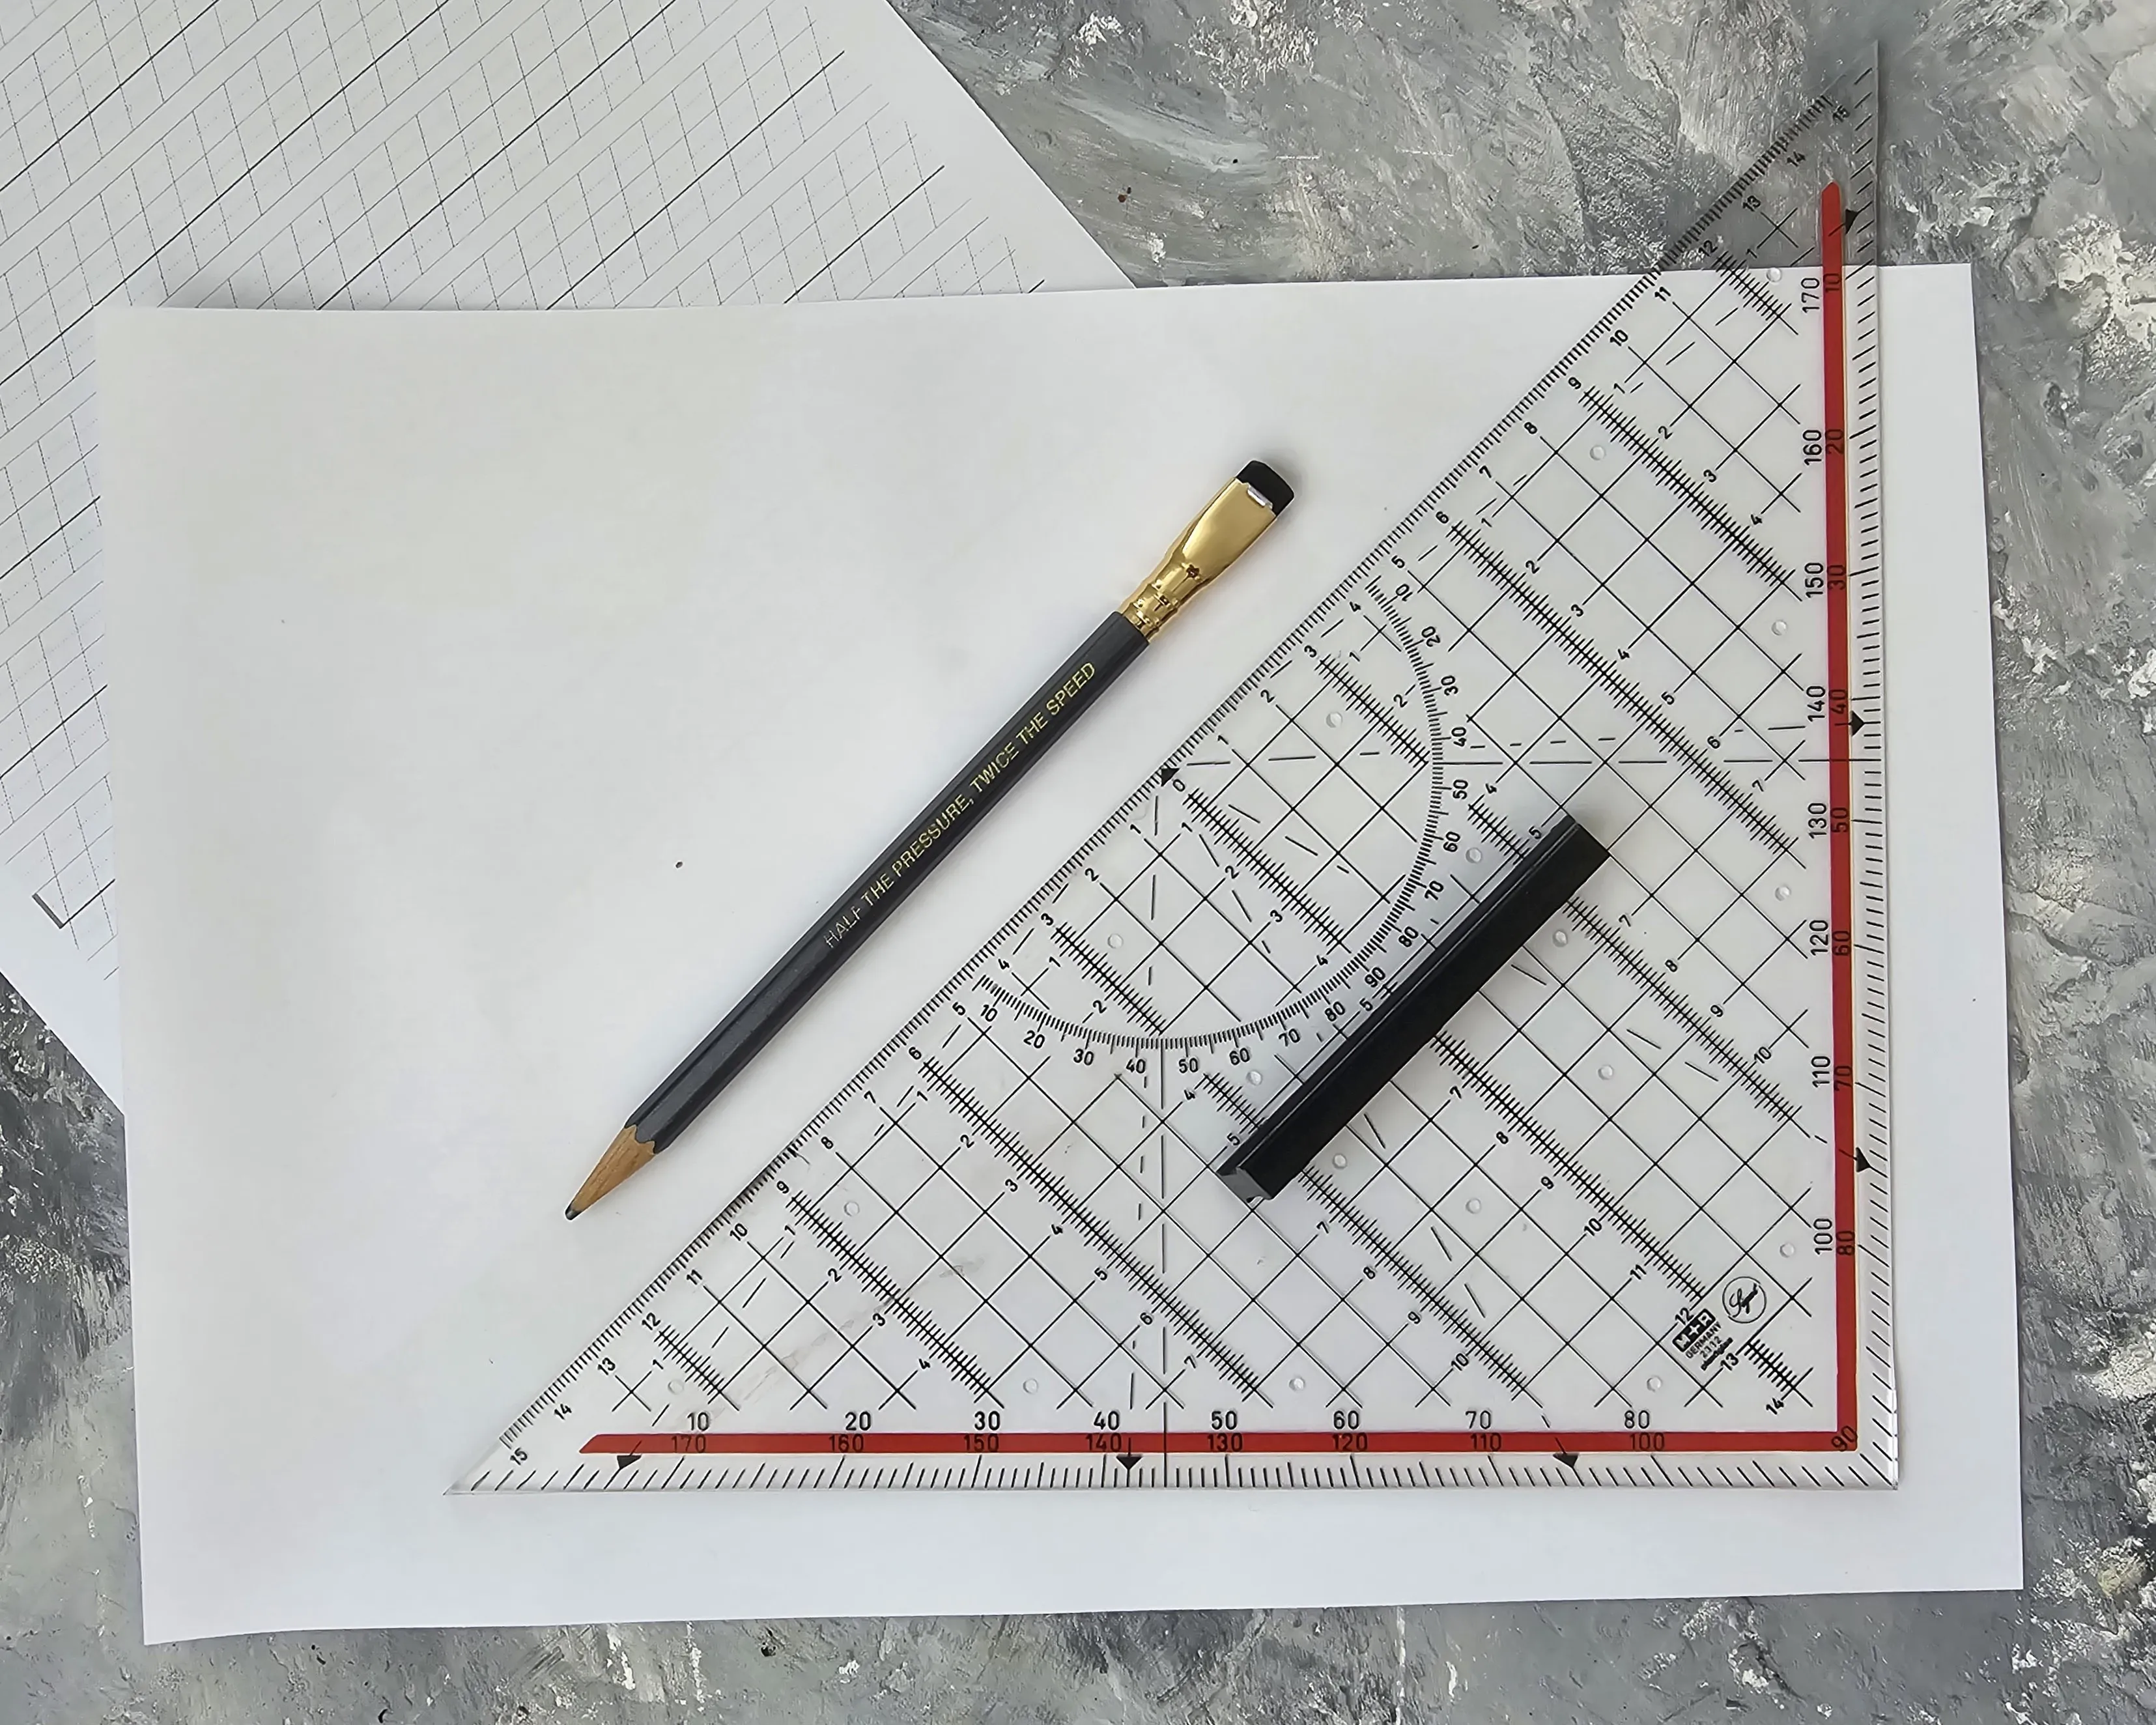
I believe every calligrapher needs to know how to draw grids by hand and I also think every calligrapher needs a great tool to draw them.
But I don’t think every calligrapher needs to get as deep into the grids as I did last winter in the days leading up to Christmas.
On Digital Grids
On Digital GridsI think we can all agree, that in our day-to-day, we want to be able to print out a grid and use that to write on.
And I assume most people don’t ever really think about drawing digital grids themselves, and just download some.
And then we—as in, the people that offer those downloads—painstakingly go ahead and manually draw them digitally in a program like Illustrator or Affinity.
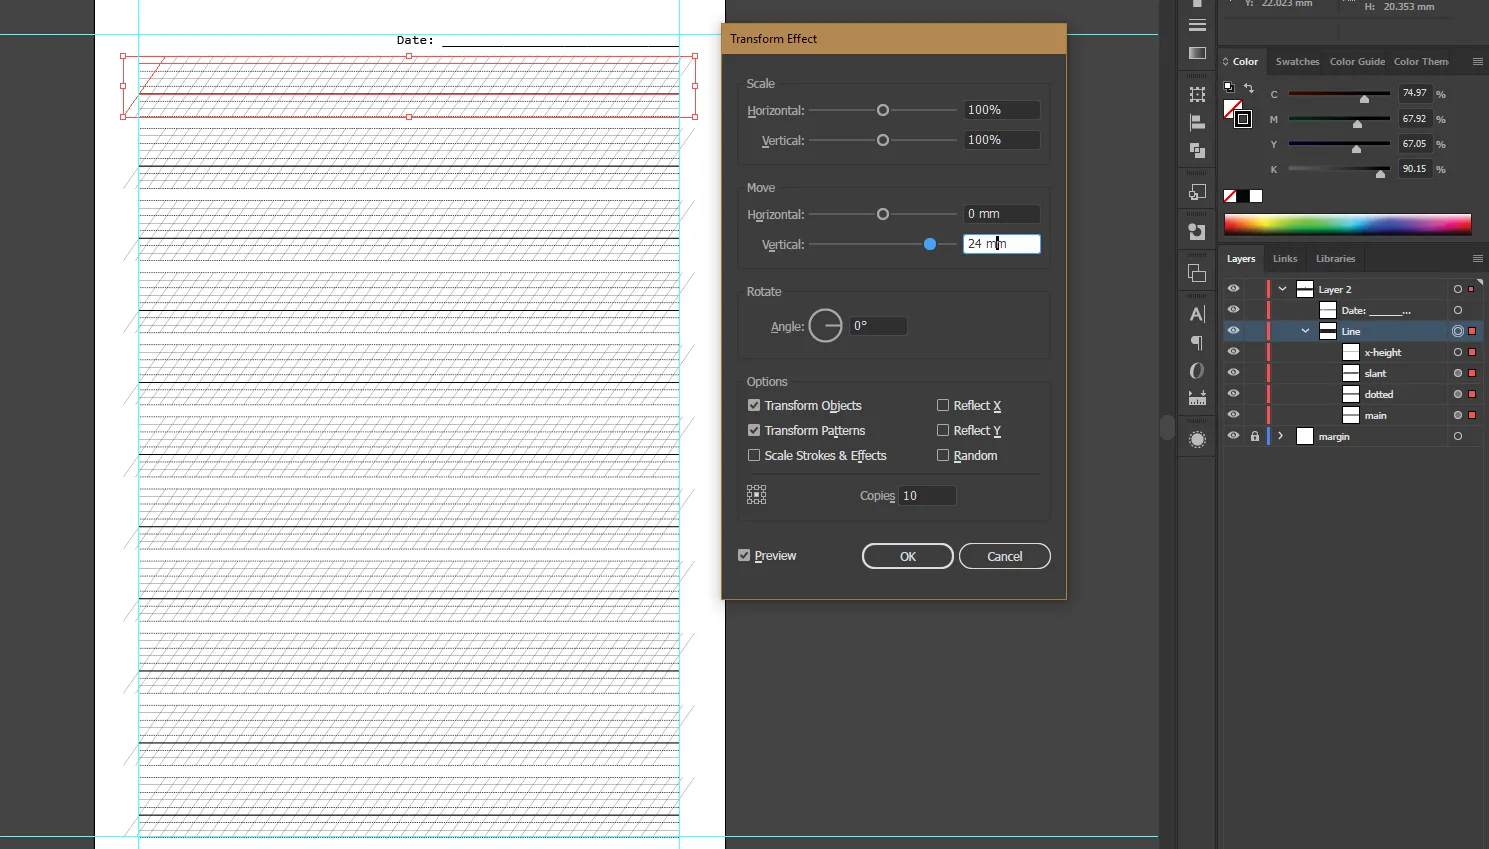
I have previously shared my very effective method, of drawing grids with just four paths in Adobe Illustrator here.
However, since Adobes prices have absolutely skyrocketed, I have recently switched to using Affinty and thus can no longer use that method.
Because even though I am generally very happy with Affinity, the Distort & Transform > Transform effect is not available in Affinity.
There are ways to duplicate elements that produce the same kind of result, but if you want to adjust the grid, you can’t just adjust it in 4 places like with the Illustrator method. You basically have to start from scratch.
I learned that last December, when I wanted to quickly throw a grid together in a different x-Height than I usually use for a notebook and realized it’s a pain in the ass.
There’s this rule in programming, that when you find yourself repeating the same kind of code, you should turn it into a function.
So, that’s what I decided to do.
And that’s how I fell into the rabbit hole of drawing grids with code.
Types of Grids
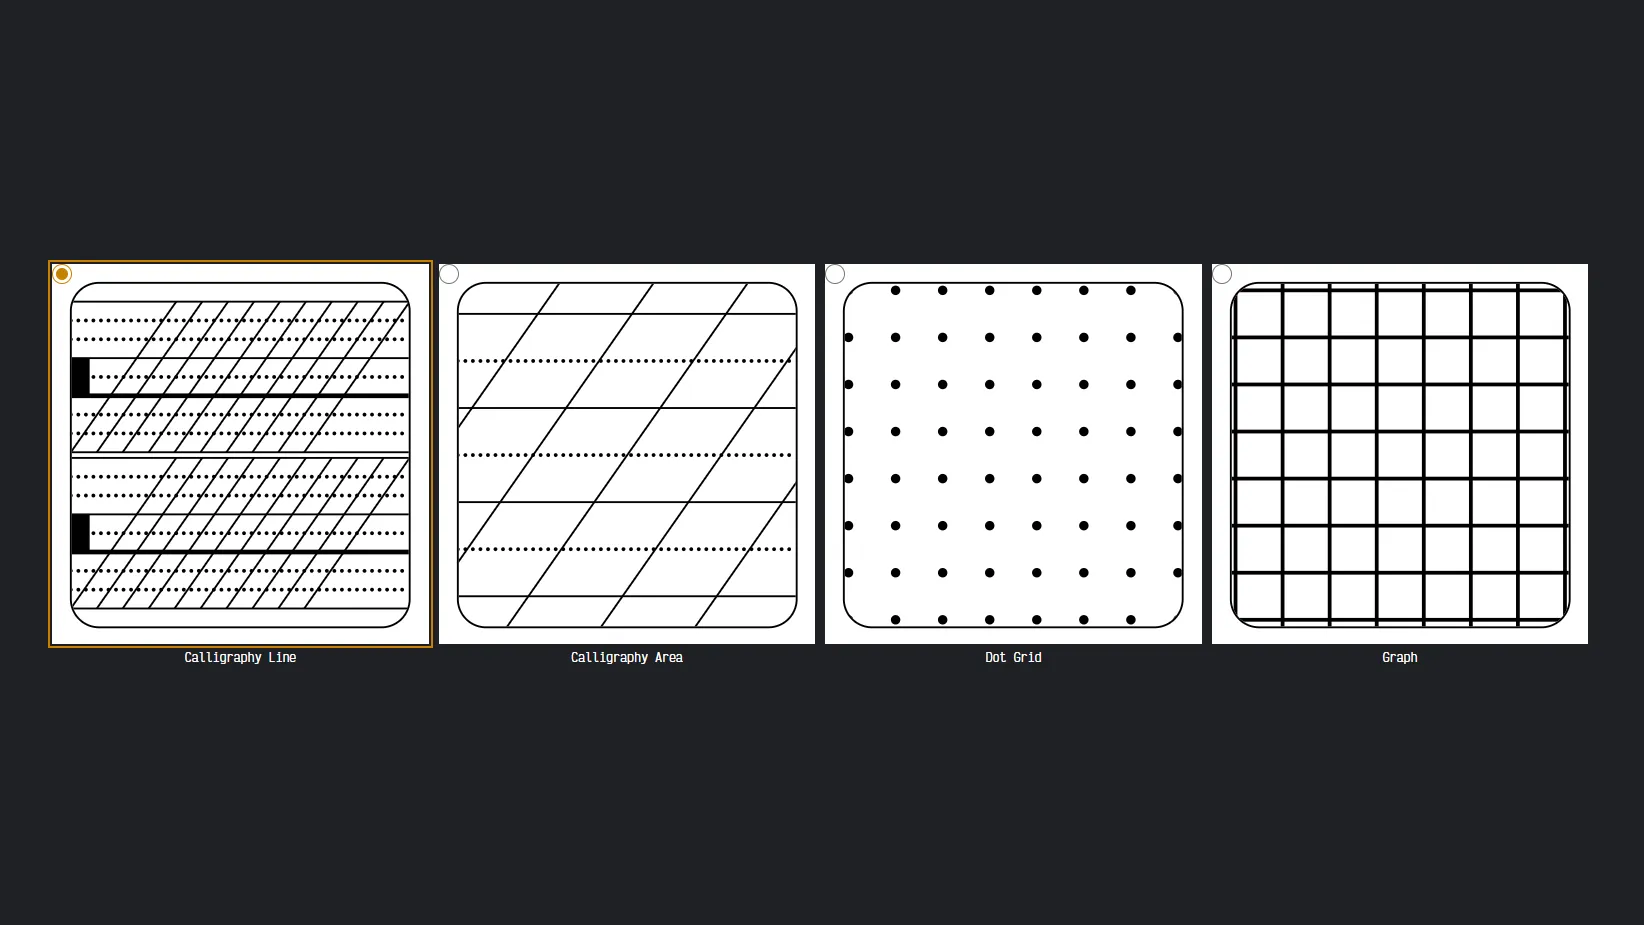
Types of GridsWith my code, I wanted to cover the basics of all major calligraphy types, so this is what it can do.
Dot Grid
Dot GridThe least restrictive and least helpful for calligraphy is the Dot Grid. It is great for Hand Lettering, but not so much for Calligraphy, since it does not even offer proper straight lines. It is great if you want to draw boxes on it, though.
Graph Grid
Graph GridThe Graph Grid is probably the most common grid you’ll find pre-printed on paper. It will work fine if you are dealing with upright letters and use consistent ratios. But it’s not very helpful for slanted scripts.
Calligraphy Area
Calligraphy AreaThis Area grid, is something I’d often create for myself, when I wanted to have flexibility of how big I wanted to write. I really like this type of grid, because It just features slant lines and lines with a pre-defined x-height and then you can space your letters how you please.
Calligraphy Lines
Calligraphy LinesThis is what I consider a proper calligraphy practice grid. It has a predefined x-height and ratio. It features slant lines to help with the angle of the letters and a small indicator where the baseline is and the x-height. This is the type of grid I’d offer in my workshops and teach on.
How Do You Even Draw With Code?
How Do You Even Draw With Code?A question you might be wondering if you aren’t a coder is how would you even draw with just code. Aren’t images always made with graphical interfaces? No, actually, there is an image format, that follows quite the semantics.
SVG
SVGSVG stands for Scalable Vector Graphics and it is a format that is used to define vector-based graphics for the Web, it is a format that Illustrator and Affinity and all other vector programs can export to, but it is also a format that features quite semantic tags that can be read and understood by humans. (At least some of them, the path tag is a bit of a mess to understand.)
JavaScript
JavaScriptWell, I guess if you were a masochist you could actually do all of the math manually, but since i wanted to end up with something generative, JavaScript became necessary.
And as someone, who always says that I am only decent at math as soon as letters are part of it, SVG Code is so much easier to understand when you are doing the math with variables instead of numbers.
Setting Parameters
Setting ParametersIt is fascinating, how much more complicated a task becomes, when it has to be solved on an abstract level, instead of just having to work with given parameters.
Drawing a grid with a ruler and a pencil, takes a few seconds. Doing it in illustrator mere minutes.
Doing this in a generic manner that allows you to adjust literally everything is a different kind of task, that took me a few days.
Believe me, I was not prepared to dig out old trigonometry memories and googling math formulas… but it is very fascinating, to dig into what actually happens mathematically, when your goal is a space-efficient, even grid.
Speaking of goals, before diving into a coding project, it’s best to define what the code is supposed to do.
So, here’s what I wanted to achieve with this code.
- The code should put out all types of grids I previously mentioned, with the ability to adjust all kinds of parameters.
- The resulting SVG should be able to be opened in Affinity and Affinity should render it like a browser (which affected the SVG features I could use).
- The end result should be something that I could offer my lettering students so that they could practice with different parameters.
Figuring Out Basic SVG Codes
Figuring Out Basic SVG CodesSo, this was my first time coding SVG. As a professional frontend engineer I have worked with a lot of SVG. It usually consists of cleaning them up, optimizing colors, making them responsive-capable and bundling them up to be used as Icons on a website.
But this was different. I was writing SVG.
There were a lot of questions in my head, but I had seen people do it before, so I was just going to start.
calligraphy Grids consist of lines and boxes and luckily, those are the easiest part of SVG.
SVGs are just a setup of a coordinate system. So in the container you define the size of your canvas and establish abstract units, which you then use to position your elements.
So, in my early tests, I started by setting up SVGs that had square canvases and then did a bit of math to figure out my coordinates.
Boxes
BoxesSo, I started by giving myself a few numbers and threw them into variables with speaking names and then added a rectangle with a stroke.
1<svg2 width={canvasWidth}3 height={canvasHeight}4>5 <rect6 width={rectWidth}7 height={rectHeight}8 fill="none"9 stroke="currentColor"10 />11</svg>The rect attribute however, also needs an x and y attribute, otherwise, it sticks to the top left of the image.
So, if we want to center it, we do:
1const rectX = (canvasWidth - rectWidth) / 2;2const rectY = (canvasHeight - rectHeight) / 2;I also added a border-radius to the rectangle, by adding an rx attribute to the rect tag.
1<svg2 width={canvasWidth}3 height={canvasHeight}4>5 <rect6 x={rectX}7 y={rectY}8 width={rectWidth}9 height={rectHeight}10 rx={borderRadius}11 fill="none"12 stroke="currentColor"13 />14</svg>Which then gives us something like this:
Show SVG Code
1<svg2 role="img"3 width="30rem"4 style="max-width: 100%; border: 1px solid red"5 viewBox="0 0 100 100"6 xmlns="http://www.w3.org/2000/svg"7>8 <title>Centered Rectangle with Border Radius</title>9 <rect10 x="20"11 y="20"12 width="60"13 height="60"14 fill="none"15 stroke="currentColor"16 rx="5"17 ></rect>18</svg>Lines
LinesHorizontal and Vertical Lines were also pretty straightforward.
<line> elements are made up of two points with x and y coordinates each.
To make horizontal lines, both y coordinates are the same and to make vertical lines, both x coordinates are the same.
So, if I want to draw a horizontal and a vertical line through the canvas, I need to know my middle point first.
So, then I can figure out my line coordinates. I like to think of it like this:
If I were to drop a line, horizontally, I’d first figure out my point on the y-axis, this is my “grid position” and then I’d figure out where my line starts on the left and where it ends on the right.
For the vertical line, I’d do the same, but the x-axis is my grid position and then I think top to bottom.
I find that easiest to visualize.
So if I wanted to draw a horizontal and a vertical line through the center, I’d do it like this:
1const middleX = canvasWidth / 2;2const middleY = canvasHeight / 2;3const lineHorizontal = {4 gridPos: middleY,5 lineStart: 0,6 lineEnd: canvasWidth,7};8const lineVertical = {9 gridPos: middleX,10 lineStart: 0,11 lineEnd: canvasHeight,12};and then I can put them into the SVG.
1<svg2 width={canvasWidth}3 height={canvasHeight}4>5 <line6 x1={lineHorizontal.lineStart}7 y1={lineHorizontal.gridPos}8 x2={lineHorizontal.lineEnd}9 y2={lineHorizontal.gridPos}10 stroke="currentColor"11 />12 <line13 x1={lineVertical.gridPos}14 y1={lineVertical.lineStart}15 x2={lineVertical.gridPos}16 y2={lineVertical.lineEnd}17 stroke="currentColor"18 />19</svg>Show SVG Code
1<svg2 role="img"3 width="30rem"4 style="max-width: 100%; border: 1px solid red"5 viewBox="0 0 421 391"6 xmlns="http://www.w3.org/2000/svg"7>8 <title>Horizontal and Vertical Line through the middle of the document</title>9 <line10 x1="0"11 y1="195.5"12 x2="421"13 y2="195.5"14 stroke="currentColor"15 stroke-width="5"16 ></line>17 <line18 x1="210.5"19 y1="0"20 x2="210.5"21 y2="391"22 stroke="currentColor"23 stroke-width="5"24 ></line>25</svg>Circles and Dashed Lines
Circles and Dashed LinesWhen it came to drawing dashed lines, my original idea was to use circles, but then I realized that that will create a lot of elements, so I decided to use dashed lines instead, which use
1<line2 x1={line.x1}3 y1={line.y1}4 x2={line.x2}5 y2={line.y2}6 stroke="currentColor"7 stroke-width={dotSize}8 stroke-dasharray={`0,${dotGap.toString()}`}9 stroke-linecap="round"10/>I did still end up going with circles for the dot Grid in the end.
Circles work a bit differently than rectangles, because they are drawn from the center and instead of a width and height they have a radius.
1<circle2 cx={circle.x}3 cy={circle.y}4 r={dotSize / 2}5 fill="currentColor"6/>Slant Lines
Slant LinesThere are different methods of making slanted lines in SVG, but the one I found most intuitive was to use the transform attribute.
In Calligraphy, our slant lines are always relative to a horizontal line, so my initial thought was to just start with a horizontal line and then rotate it. In code, we rotate clockwise, so a positive number rotates the line to the right and since we want to rotate it to the left, we use a negative number. We’ll also need to specify a point to rotate around, so we’ll use the middle of our line.
Obviously, my angle had to be 55, because Calligraphy.
1const lineStart = 0;2const lineEnd = canvasWidth;3const lineY = canvasHeight / 2;4const angle = 55;5const lineCenterPointX = (lineEnd - lineStart) / 2;6const lineCenterPointY = lineY;7
8<svg viewBox={"0 0 ${canvasWidth} ${canvasHeight}"}>9 <line10 x1={lineStart}11 y1={lineY}12 x2={lineEnd}13 y2={lineY}14 stroke="currentColor"15 />16 <line17 x1={lineStart}18 y1={lineY}19 x2={lineEnd}20 y2={lineY}21 stroke="currentColor"22 transform={`rotate(${angle * -1}, ${lineCenterPointX}, ${lineCenterPointY})`}23 />24</svg>;Show SVG Code
1<svg2 role="img"3 width="30rem"4 style="max-width: 100%; border: 1px solid red"5 viewBox="0 0 220 230"6 xmlns="http://www.w3.org/2000/svg"7>8 <title>slanted line and horizontal line crossing</title>9 <line10 x1="0"11 y1="115"12 x2="220"13 y2="115"14 stroke="currentColor"15 ></line>16 <line17 x1="0"18 y1="115"19 x2="220"20 y2="115"21 stroke="currentColor"22 transform="rotate(-55, 110, 115)"23 ></line>24</svg>The way we draw slant lines in our classic calligraphy line though, ended up not being rotated with transform, but using some trigonometry.
But this was a problem for later.
I had gathered all of my information and was ready to get into my coding project.
Technical Setup
Technical SetupI decided to write a collection of Typescript Classes that would help me generate the SVGs. First, I’d write a class that would set up the entire document and some shared functionality and then I’d write a subclass for each type of grid.
I went with Typescript because I wanted to be able to use Interfaces for the configuration Objects and to just make it a bit more structured.
I wanted my grids to be placed on a traditional paper size and have a document title that mentioned the grid type and some of the useful parameters like the x-height, slant angle, ratio etc, depending on each type.
And then I’d also like a box around the grid with some rounded corners for that classic look.
I started with my classic graph grid.
Which was done fairly quickly, it was just throwing a bunch of horizontal and vertical lines onto the canvas by taking my cell-Size and my drawing area into account.
Wait, You Drew Every Single Line?
Wait, You Drew Every Single Line?Let’s do a quick interlude here from a future version of me, who had written this entire thing and was planning to refactor the website part of this.
But then I had a conversation with a coworker, who is a lot more experienced with SVG than I am and he told me about the pattern tag.
So, as soon as I heard about that, I set out, to make my code more efficient and cool and was planning to rewrite the entire thing.
I prototyped it with Dot and Graph Grids and it was soo cool.
pattern allows you to define a pattern that can be used to fill a shape. So, I could just define my lines once and then use them to fill my entire drawing area.
Graph Grid With Pattern
Graph Grid With PatternIf you think about it, a graph is just a bunch of horizontal and vertical lines that repeat across the x and y axis.
So, pattern can help us with that. We can create a <rect> and then reference a pattern in the fill attribute of the rect.
The pattern then has it’s own width and height and viewBox which define how the pattern is repeated.
So, let’s say we want to perfectly center our graph grid in any given width or height, and we want to be able to say how big our little squares are.
1const patternHeight = (cellSize / graphDocHeight) * 100;2const patternWidth = (cellSize / graphDocWidth) * 100;3const gridYStart = (graphDocHeight % cellSize) / 2;4const gridXStart = (graphDocWidth % cellSize) / 2;5
6<svg viewBox={"0 0 ${docWidth} ${docHeight}"}>7  <defs>8    <pattern9      id="horizontal"10      viewBox={`0 0 ${docWidth} ${strokeWidth}`}11      width="100%"12      height={`${patternHeight}%`}13    >14      <line15        x1="0"16        x2={docWidth}17        y1={gridYStart}18        y2={gridYStart}19        stroke={strokeColor}20        stroke-width={strokeWidth}21      ></line>22    </pattern>23    <pattern24      id="vertical"25      viewBox={`0 0 ${strokeWidth} ${docHeight}`}26      width={`${patternWidth}%`}27      height="100%"28    >29      <line30        y1={0}31        y2={docHeight}32        x1={gridXStart}33        x2={gridXStart}34        stroke={strokeColor}35        stroke-width={strokeWidth}36      ></line>37    </pattern>38  </defs>39  <rect40    width={docWidth}41    height={docHeight}42    fill="url(#horizontal)"43  ></rect>44  <rect45    width={docWidth}46    height={docHeight}47    fill="url(#vertical)"48  ></rect>49</svg>;
And then our grid basically happens like magic.
I was so excited about this.
Show SVG Code
1<svg2 role="img"3 style="max-width: 100%; border: 1px solid red"4 viewBox="0 0 226 101"5 xmlns="http://www.w3.org/2000/svg"6>7 <title>Graph Grid with pattern</title>8 <defs>9 <pattern10 id="horizontal"11 viewBox="0 0 226 0.3"12 width="100%"13 height="4.9504950495049505%"14 >15 <line16 x1="0"17 x2="226"18 y1="0.5"19 y2="0.5"20 stroke="currentColor"21 stroke-width="0.3"22 ></line>23 </pattern>24 <pattern25 id="vertical"26 viewBox="0 0 0.3 101"27 width="2.2123893805309733%"28 height="100%"29 >30 <line31 y1="0"32 y2="101"33 x1="0.5"34 x2="0.5"35 stroke="currentColor"36 stroke-width="0.3"37 ></line>38 </pattern>39 </defs>40 <rect41 width="226"42 height="101"43 fill="url(#horizontal)"44 ></rect>45 <rect46 width="226"47 height="101"48 fill="url(#vertical)"49 ></rect>50</svg>Dot Grid With Pattern
Dot Grid With PatternDot Grid is even cooler. We can just take one line with a dashed line that’s made to look like dots and repeat that.
1const gridYStart = (docHeight % cellSize) / 2;2const gridXStart = (docWidth % cellSize) / 2;3const patternHeight = (cellSize / docHeight) * 100;4
5<svg viewBox={"0 0 ${docWidth} ${docHeight}"}>6 <defs>7 <pattern8 id="horizontal-dotted-line"9 viewBox={`0 0 ${docWidth} ${dotSize}`}10 width="100%"11 height={`${patternHeight}%`}12 >13 <line14 x1={gridXStart}15 y1={gridYStart}16 x2={docWidth}17 y2={gridYStart}18 stroke={strokeColor}19 stroke-width={dotSize}20 stroke-dasharray={`0,${cellSize}`}21 stroke-linecap="round"22 ></line>23 </pattern>24 </defs>25 <rect26 x="0"27 y="0"28 width={docWidth}29 height={docHeight}30 fill="url(#horizontal-dotted-line)"31 ></rect>32</svg>;Show SVG Code
1<svg2 role="img"3 style="max-width: 100%; border: 1px solid red"4 viewBox="0 0 219 100"5 xmlns="http://www.w3.org/2000/svg"6>7 <title>dot Grid with pattern</title>8 <defs>9 <pattern10 id="horizontal-dotted-line"11 viewBox="0 0 219 0.5"12 width="100%"13 height="4%"14 >15 <line16 x1="1.5"17 y1="0"18 x2="219"19 y2="0"20 stroke="currentColor"21 stroke-width="0.5"22 stroke-dasharray="0,4"23 stroke-linecap="round"24 ></line>25 </pattern>26 </defs>27 <rect28 x="0"29 y="0"30 width="219"31 height="100"32 fill="url(#horizontal-dotted-line)"33 ></rect>34</svg>However, that was already at a point where I had learned that in Affinity <mask> does not work, while <clipPath> does. And I had to adjust my code accordingly, so everything coming out beyond the rounded corners of my area got cut off.
So, I was cautious to not get too excited about this, and make every grid before testing.
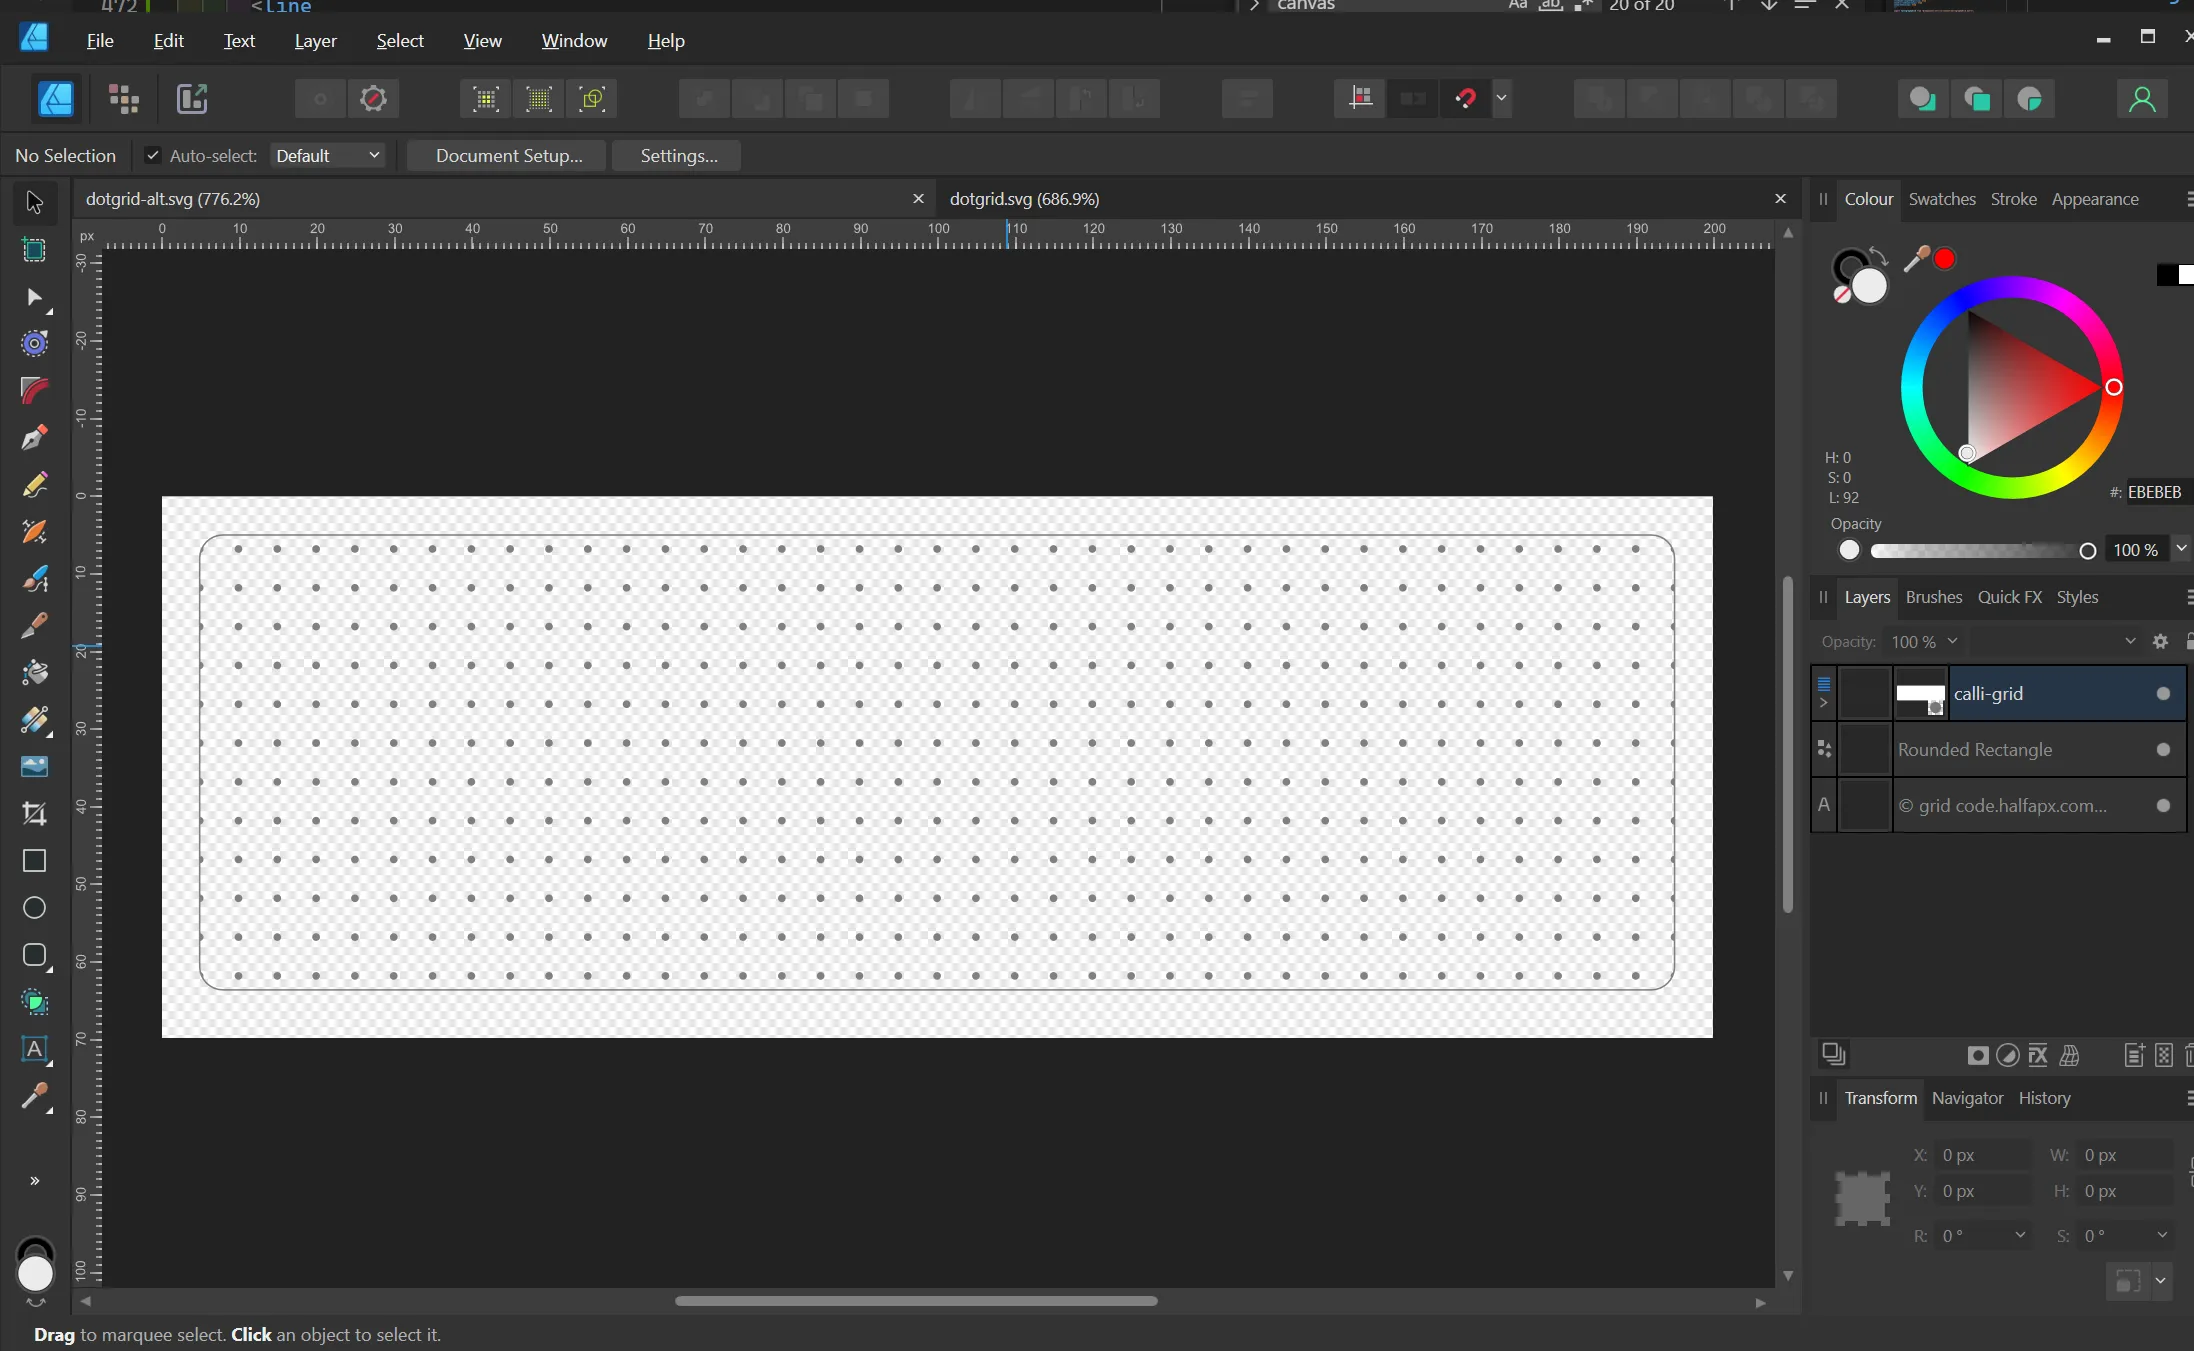
And this is where I stopped and saved my svg and then opened it in Affinity.
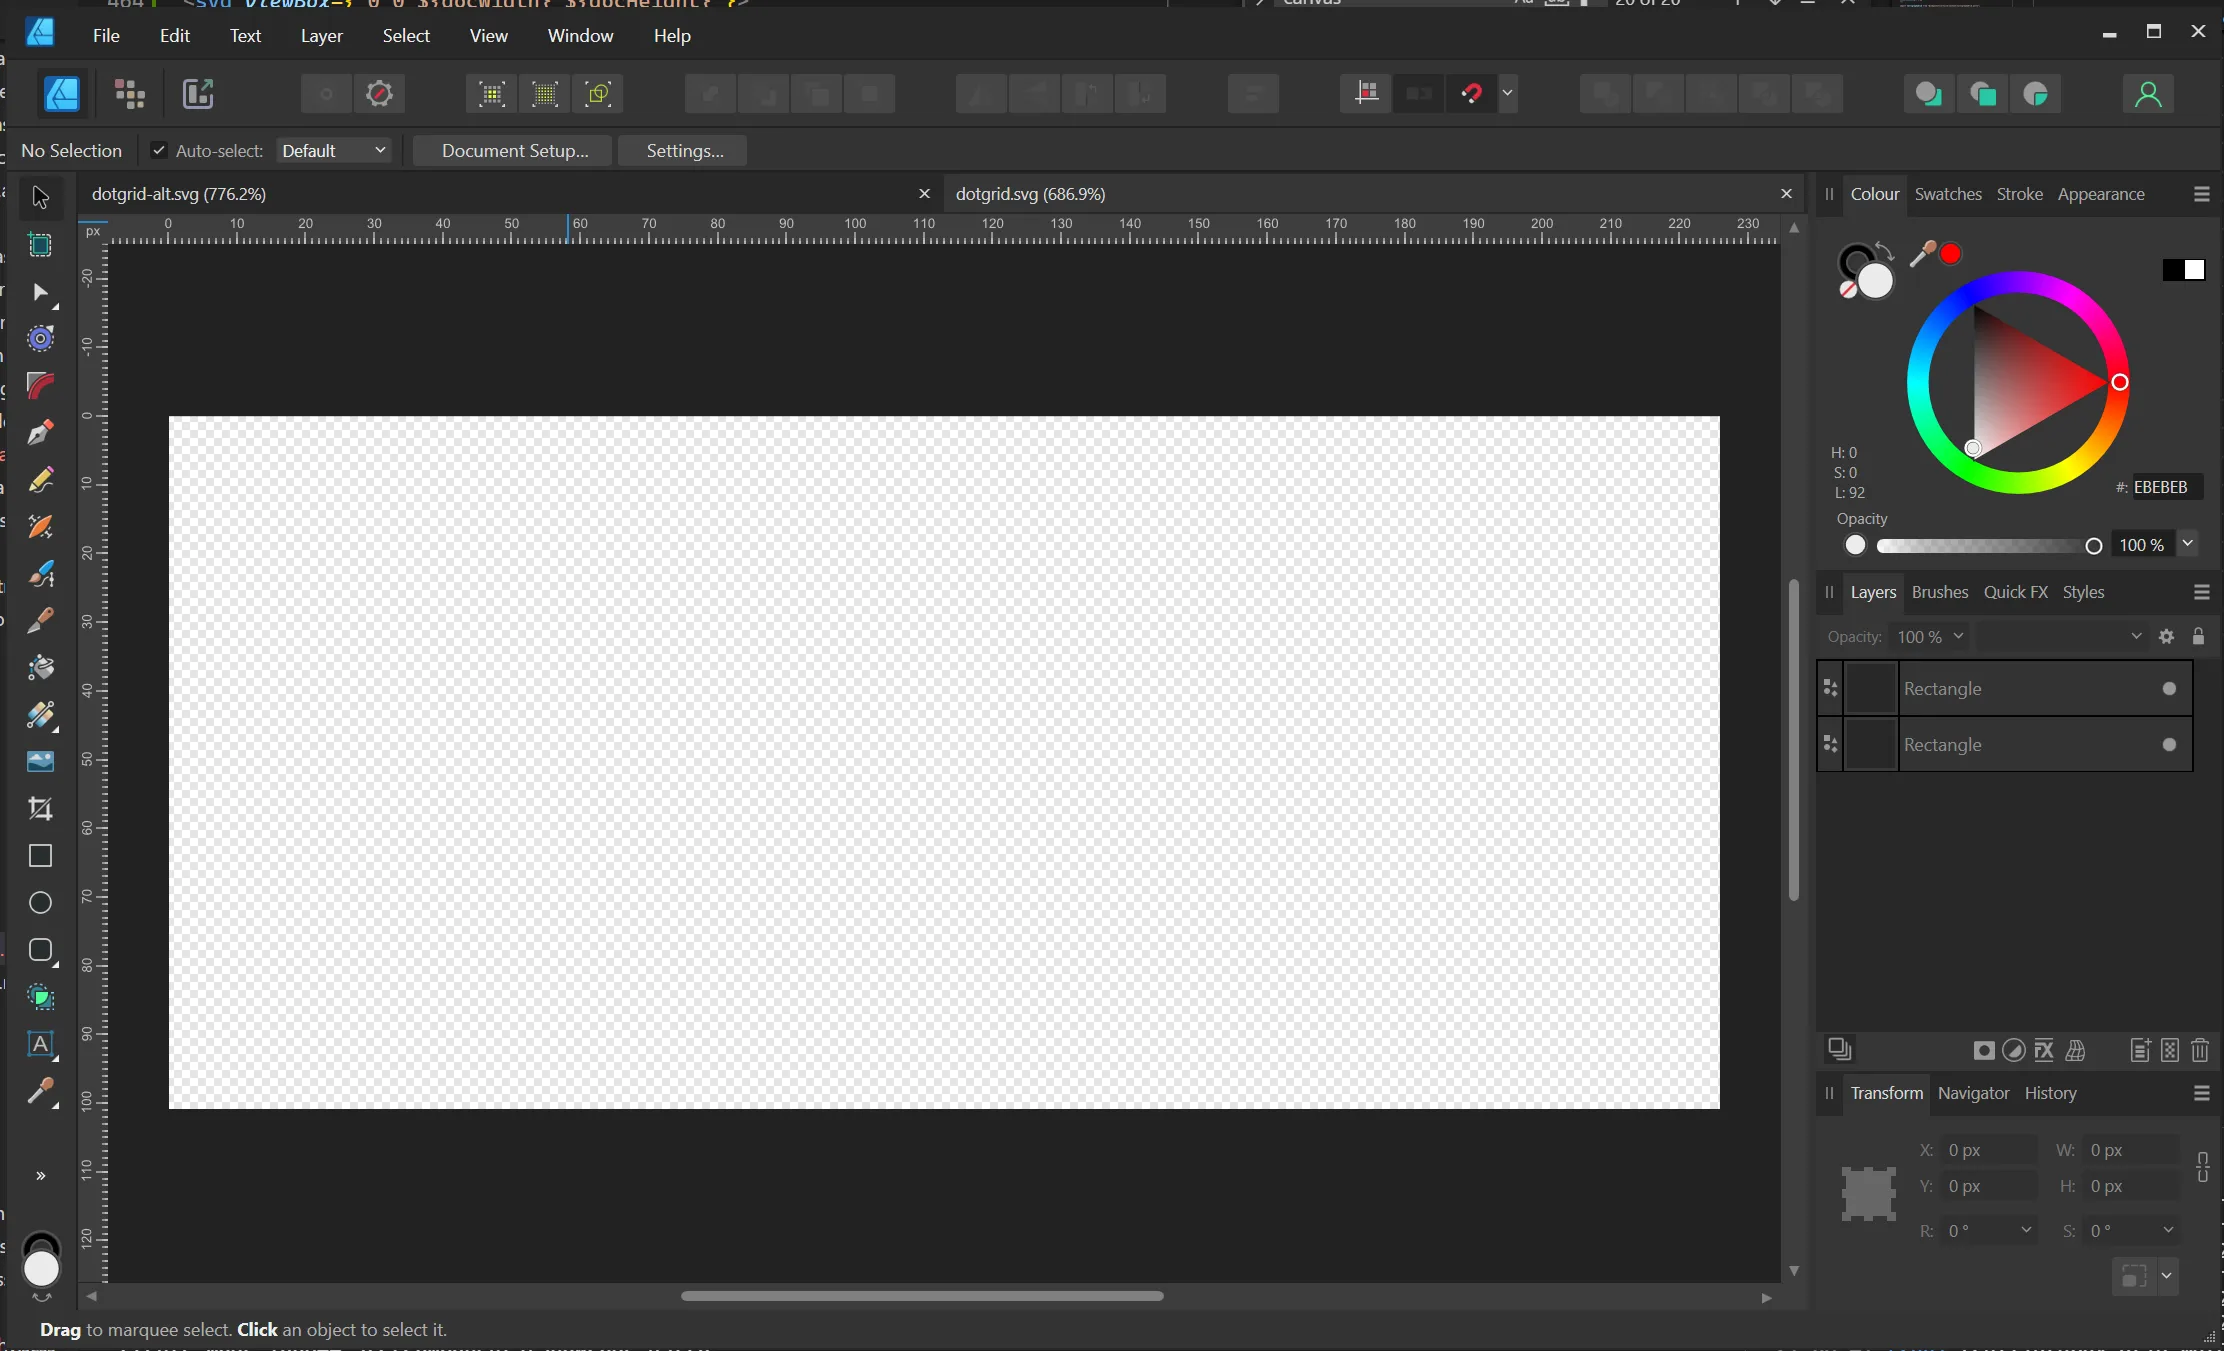
Yeah, one big nothing.
Well, I guess in the end, it is good I didn’t create everything with pattern because then I’d have to rewrite it all.
Because now I just knew to save myself the effort. Because the solution I had was working.
Let’s Talk Math
Let’s Talk MathOkay, so, the pattern did not work for me, so I had to do a lot of repetition and loops.
Let’s look at the math for each of the grids and how they are constructed.
Line Drawing Function and general Class Setup
Line Drawing Function and general Class SetupI won’t be sharing the entire code here. It’s open-source and you can dive deep into it there.
Generally, in my classes there are two drawing functions makeSVG() and makeSVGString()
And then each subclass hooks into that and adds its specific grid.
There are then helper functions to create groups (<g> tags that make it easier to have similar elements in one place) and to add lines. There was also some masking involved for the rounded area box.
I also have a function that formats coordinates, because more than two floating points make the SVG file bigger and usually the result will be exact enough with two.
You’ll see addSolidLine and addDashedLine functions in the code, but they are just wrappers around addLine that make it quicker to read whether it’s a horizontal or vertical line and if it’s solid or dashed.
1export class GridMaker {2  // [...]3
4  makeSVG(): SVGElement {5    const svg = this.createDocument('dom') as SVGElement;6    svg.innerHTML = this.addSVGContent();7    return svg;8  }9
10  makeSVGString(addCloseTag: boolean = true): string {11    let svgString = this.createDocument('string') as string;12    svgString += this.addSVGContent();13    if (addCloseTag) {14      svgString += '</svg>';15    }16    return svgString;17  }18
19  drawSolidLine(orientation: 'horizontal' | 'vertical', gridPos: number, lineStart: number, lineEnd: number, color: string, stroke: number): string {20    let x1,x2,y1,y2;21    if (orientation === 'horizontal') {22      x1 = lineStart;23      x2 = lineEnd;24      y1 = y2 = gridPos;25    }26    if (orientation === 'vertical') {27      y1 = lineStart;28      y2 = lineEnd;29      x1 = x2 = gridPos;30    }31    return this.addLine(x1, y1, x2, y2, color, stroke);32  }33
34  drawDashedLine(orientation: 'horizontal' | 'vertical',gridPos: number,lineStart: number,lineEnd: number,dotRadius: number,dotColor: string): string {35    const dotSize = dotRadius * 2;36    const dotGap = dotRadius * 4;37    let x1, x2, y1,y2;38    if (orientation === 'horizontal') {39      x1 = lineStart;40      x2 = lineEnd;41      y1 = y2 = gridPos;42    }43    if (orientation === 'vertical') {44      y1 = lineStart;45      y2 = lineEnd;46      x1 = x2 = gridPos;47    }48    return this.addLine(x1,y1,x2,y2,dotColor,dotSize,`0,${dotGap.toString()}`,'round');49  }50
51  drawSlantLine(): string {52    // we'll get into this later53  }54
55  addLine(x1: number, y1: number, x2: number, y2: number, color: string, stroke: number, srokeDashArray?: string, strokeLineCap?: 'round' | 'square' | 'butt'): string {56    return /*html*/ `57        <line58          x1="${this.formatCoordinate(x1)}"59          y1="${this.formatCoordinate(y1)}"60          x2="${this.formatCoordinate(x2)}"61          y2="${this.formatCoordinate(y2)}"62          stroke="${color}"63          stroke-width="${stroke}"64          ${srokeDashArray ? `stroke-dasharray="${srokeDashArray}"` : ''}65          ${strokeLineCap ? `stroke-linecap="${strokeLineCap}"` : ''}66        />67      `;68  }69}
Graph
GraphSo, in the graph grid, we have a bunch of horizontal and vertical lines that are all the same distance apart.
And then we can just start a loop for the number of repetitions we got and draw a line for each.
1export class GraphGridPage extends GridMaker {2  // [...]3  private addGraphGrid(): string {4    const cellSize = this.#config.cellSize!;5    const xEnd = this.width - this.marginRight;6    const yEnd = this.height - this.marginBottom;7    const horizontalReps = this.gridHeight / cellSize;8    const horizontalRemainder = this.gridHeight % cellSize;9    const verticalReps = this.gridWidth / cellSize;10    const verticalRemainder = this.gridWidth % cellSize;11
12    let gridParent = this.createGroup('grid','calli-grid',this.maskId ? this.maskId : undefined,);13
14    let yLineStart = this.marginTop + horizontalRemainder / 2;15    for (let i = 0; i <= horizontalReps; i++) {16      const line = this.drawSolidLine('horizontal',yLineStart,this.marginLeft,xEnd,this.#config.lineColor,this.#config.gridStrokeWidth);17      yLineStart += cellSize;18      gridParent += line;19    }20
21    let xLineStart = this.marginLeft + verticalRemainder / 2;22    for (let i = 0; i <= verticalReps; i++) {23      const line = this.drawSolidLine('vertical',xLineStart,this.marginTop,yEnd,this.#config.lineColor,this.#config.gridStrokeWidth);24      xLineStart += cellSize;25      gridParent += line;26    }27
28    gridParent += '</g>';29
30    return gridParent;31  }32}
Dot Grid
Dot GridThe Dot grid is setup similarly, but here, we’re not drawing lines in the loops, but instead, we’re adding x and y coordinates into arrays, which then gives us the coordinates of where the horizontal and vertical lines intersect. This is where we then draw the dots using circle elements.
1export class DotGridPage extends GridMaker {2  // [...]3  private addDotGrid(): string {4    const cellSize = this.#config.cellSize!;5    const horizontalReps = this.gridHeight / cellSize;6    const horizontalRemainder = this.gridHeight % cellSize;7    const verticalReps = this.gridWidth / cellSize;8    const verticalRemainder = this.gridWidth % cellSize;9    const horizontalIntersections: number[] = [];10    const verticalIntersections: number[] = [];11
12    let yLineStart = this.marginTop + horizontalRemainder / 2;13    for (let i = 0; i <= horizontalReps; i++) {14      horizontalIntersections.push(yLineStart);15      yLineStart += cellSize;16    }17
18    let xLineStart = this.marginLeft + verticalRemainder / 2;19    for (let i = 0; i <= verticalReps; i++) {20      verticalIntersections.push(xLineStart);21      xLineStart += cellSize;22    }23
24    let gridParent = this.createGroup('grid','calli-grid',this.maskId ? this.maskId : undefined);25
26    for (const horizontalPoint of horizontalIntersections) {27      for (const verticalPoint of verticalIntersections) {28        const dot = `<circle cx="${this.formatCoordinate(verticalPoint)}" cy="${this.formatCoordinate(29          horizontalPoint,30        )}" r="${this.#config.dotSize! / 2}" fill="${this.#config.lineColor!}" />`;31        gridParent += dot;32      }33    }34    gridParent += '</g>';35    return gridParent;36  }37}
Let’s Talk About Slant Lines
Let’s Talk About Slant LinesOkay, let’s go back to the slant lines and the problems with rotations I mentioned.
At that point, I had not yet learned that clipPath could solve my issue of mask not working in Affinity and my PDF export. I was living with the issue of lines being outside of my rounded corners, but I could not have slant lines protruding out of my area everywhere.
So, what I usually had was a start point of my line, and then usually the length of the line, as well as the angle of it. So, then I could calculate the end point of the line using trigonometry.
So, the drawSlantLine function is not one that implements a transform, but instead calculates the end point of the line and then draws a line via coordinates.
1drawSlantLine(lineHeight: number,angle: number, xStart: number, yStart: number, color: string,stroke: number): string {2 const xEnd = xStart + lineHeight / Math.tan((angle * Math.PI) / 180);3 const yEnd = yStart - lineHeight;4 const line = this.addLine(xStart, yStart, xEnd, yEnd, color, stroke);5 return line;6}I also have a few limitations for slant lines right now, with the current methods. So right now, my angle needs to fall below 90 and above 25degrees for optimal results, but I think since we’re in calligraphy world, that is fine.
There is always a graph grid for 90 degrees and I don’t think people write that steep ever, or slanted backwards.
Calligraphy Area
Calligraphy AreaOkay, let’s look at the Calligraphy Area grid.
In addition to just having horizontal lines at the x-height distance, I also wanted to have the option to add separator lines for half of the x-height, since I like to reference these in my letters, like t, p, e etc.
And then in the Area Context, I wanted to have one main slant line spanning from the bottom left corner to the top left, and then being able to specify how far apart the slant lines should be, and also how long they should be at minimum, since I felt like having tiny lines all the way to the corners was a waste of space and parameters.
So, first it was drawing horizontal lines and separator lines and then it was about figuring out the slant lines.
We start by drawing the longest line, through the middle, and then adding lines to the left and right of it, at the specified distance. And then we have to jump through extra hoops because I didn’t know about clip Path and had to make sure the lines didn’t go outside of the area, by calculating intersection points with the area and then trimming the lines to those points.
In the end, I am not going to rewrite this and use the mask, because this makes the resulting svg cleaner, so I’m keeping it like this, but I could’ve saved myself a lot of headache, because trigonometry is not my strong suit.
1export class CalligraphyAreaPage extends GridMaker {2  // [...]3  private addCalligraphyArea(): string {4    const xHeight = this.#config.xHeight;5    const horizontalReps = this.gridHeight / xHeight;6    const horizontalRemainder = this.gridHeight % xHeight;7    const lineStart = this.marginLeft;8    const lineEnd = this.width - this.marginRight;9    const color = this.#config.lineColor;10    const stroke = this.#config.gridStrokeWidth;11    const dotSize = this.#config.gridStrokeWidth;12    const rectCenterX = this.marginLeft + this.gridWidth / 2;13    const rectCenterY = this.marginTop + this.gridHeight / 2;14    const rectDiagonal = Math.sqrt(15      Math.pow(this.gridWidth, 2) + Math.pow(this.gridHeight, 2),16    );17    const lineAngle = 180 - this.#config.slantAngle;18    const slantSpacing = this.#config.slantAngleGap;19    // we're using the diagonal length as a basis to ensure we cover the entire area with our function20    const slantReps = rectDiagonal / slantSpacing;21
22    let gridParent = this.createGroup('grid','calli-grid',this.maskId ? this.maskId : undefined);23
24    let horizontalLines = this.createGroup('horizontal-lines');25    let yLineStart = this.marginTop + horizontalRemainder / 2;26    for (let i = 0; i <= horizontalReps; i++) {27      const line = this.drawSolidLine('horizontal',yLineStart,lineStart,lineEnd,color,stroke);28      if (this.#config.addDividerLines) {29        if (i < horizontalReps) {30          const gridPos = yLineStart + xHeight / 2;31          const line = this.drawDashedLine('horizontal',gridPos,lineStart,lineEnd,dotSize,color);32          horizontalLines += line;33        }34      }35      yLineStart += xHeight;36      horizontalLines += line;37    }38    gridParent += horizontalLines;39
40    let slantLines = this.createGroup('slant-lines');41
42    const angleRad = (lineAngle * Math.PI) / 180;43    const centerLineLength = rectDiagonal / 2;44    const lineStartX = rectCenterX - centerLineLength * Math.cos(angleRad);45    const lineStartY = rectCenterY - centerLineLength * Math.sin(angleRad);46    const lineEndX = rectCenterX + centerLineLength * Math.cos(angleRad);47    const lineEndY = rectCenterY + centerLineLength * Math.sin(angleRad);48
49    const line = this.drawLineWithinArea(lineStartX,lineStartY,lineEndX,lineEndY,color,stroke);50
51    slantLines += line;52
53    let distance = slantSpacing;54    for (let i = 0; i < slantReps; i++) {55      // draw lines to the left and right of center line56      const linesLeft = this.createParallelLine(lineStartX,lineStartY,lineEndX,lineEndY,distance,color,stroke,this.#config.slantLineMinLength);57      const linesRight = this.createParallelLine(lineStartX,lineStartY,lineEndX,lineEndY,distance * -1,color,stroke,this.#config.slantLineMinLength);58      slantLines += linesLeft;59      slantLines += linesRight;60      distance += slantSpacing;61    }62
63    gridParent += slantLines;64    gridParent += '</g>';65    return gridParent;66  }67
68  private createParallelLine(x1: number,y1: number,x2: number,y2: number,distance: number,color: string,stroke: number,maxLength: number | undefined,): string {69    const {x1: newX1,y1: newY1,x2: newX2,y2: newY2} = this.generateParallelCoordinates(x1, y1, x2, y2, distance);70
71    return this.drawLineWithinArea(newX1,newY1,newX2,newY2,color,stroke,maxLength);72  }73
74  private generateParallelCoordinates(x1: number,y1: number,x2: number,y2: number,distance: number,): { x1: number; y1: number; x2: number; y2: number } {75    // Calculate offsets for the new line based on the distance provided76    const xOffset = distance;77
78    // Calculate new coordinates for the parallel line along the X-axis79    const newX1 = x1 + xOffset;80    const newY1 = y1;81    const newX2 = x2 + xOffset;82    const newY2 = y2;83
84    return { x1: newX1, y1: newY1, x2: newX2, y2: newY2 };85  }86
87  private drawLineWithinArea(x1: number,y1: number,x2: number,y2: number,color: string,stroke: number,maxLength?: number,): string {88    const intersectionPoints = this.calculateIntersectionPoints(x1, y1, x2, y2); // Corrected parameter order89    let line = '';90
91    if (intersectionPoints.length > 0) {92      // Trim the line to start and end at the intersection points93      let trimmedX1 = x1;94      let trimmedY1 = y1;95      let trimmedX2 = x2;96      let trimmedY2 = y2;97
98      if (intersectionPoints.length >= 2) {99        trimmedX1 = intersectionPoints[0]?.x ?? x1;100        trimmedY1 = intersectionPoints[0]?.y ?? y1;101        trimmedX2 = intersectionPoints[1]?.x ?? x2;102        trimmedY2 = intersectionPoints[1]?.y ?? y2;103      }104
105      const trimmedLineLength = Math.sqrt((trimmedX2 - trimmedX1) ** 2 + (trimmedY2 - trimmedY1) ** 2,);106
107      const lineColor = color;108      if (maxLength) {109        if (trimmedLineLength > maxLength) {110          line = this.addLine(trimmedX1,trimmedY1,trimmedX2,trimmedY2,lineColor,stroke);111        }112      } else {113        line = this.addLine(trimmedX1,trimmedY1,trimmedX2,trimmedY2,lineColor,stroke);114      }115    }116    return line;117  }118
119  private calculateIntersectionPoints(lineX1: number,lineY1: number,lineX2: number,lineY2: number): Point[] {120    const rectX = this.marginLeft;121    const rectY = this.marginTop;122    const rectWidth = this.gridWidth;123    const rectHeight = this.gridHeight;124
125    const slope = (lineY2 - lineY1) / (lineX2 - lineX1);126    const yIntercept = lineY1 - slope * lineX1;127    const isInsideRectangle = (x: number, y: number) =>128      x >= rectX &&129      x <= rectX + rectWidth &&130      y >= rectY &&131      y <= rectY + rectHeight;132    const topIntersectionX = (rectY - yIntercept) / slope;133    const bottomIntersectionX = (rectY + rectHeight - yIntercept) / slope;134    const leftIntersectionY = slope * rectX + yIntercept;135    const rightIntersectionY = slope * (rectX + rectWidth) + yIntercept;136
137    const intersectionPoints: Point[] = [];138
139    if (isInsideRectangle(topIntersectionX, rectY)) {140      intersectionPoints.push({ x: topIntersectionX, y: rectY });141    }142    if (isInsideRectangle(bottomIntersectionX, rectY + rectHeight)) {143      intersectionPoints.push({144        x: bottomIntersectionX,145        y: rectY + rectHeight,146      });147    }148    if (isInsideRectangle(rectX, leftIntersectionY)) {149      intersectionPoints.push({ x: rectX, y: leftIntersectionY });150    }151    if (isInsideRectangle(rectX + rectWidth, rightIntersectionY)) {152      intersectionPoints.push({ x: rectX + rectWidth, y: rightIntersectionY });153    }154    return intersectionPoints;155  }156}
Calligraphy Lines
Calligraphy LinesThe piece de resistance, my workhorse, my beloved, the Calligraphy Lines grid.
Here, I wanted a few more parameters to be adjustable. Not only the slant angle, but also the x-height and the ratio.
And in the calligraphy line grid, I wanted to draw the slant lines differently, Here I wanted the first line to start at the bottom left corner of the descender line and the last line to end at the top right corner of the ascender line.
So, specifying a gap is not really going to work here, because there might be something over if I’m placing lines between two lines. So instead, I opted to have a value of how many lines are drawn between and then they are evenly spaced.
I also wanted the baseline to be bolder than the others, and the option to add an indicator on the left for the baseline.
When using the area Box, I also wanted to be able to specify a buffer, so that the lines don’t start right at the top and are cut off by the rounded corners. That is very much a stylistic choice though, so it was configurable again.
The main grid is drawn like the graph Grid horizontal lines, and then there is a separate drawing function, to take care of drawing ascender, descender, base line, slant lines and all the other optional lines.
1export class CalligraphyLinePage extends GridMaker {2  get lineHeight(): number {3    const { ascender, base, descender } = this.normalizedRatio;4    return this.xHeight * (ascender + base + descender);5  }6
7  get ratio(): { ascender: number; base: number; descender: number } {8    return {9      ascender: this.#config.ratioAscender,10      base: this.#config.ratioBase,11      descender: this.#config.ratioDescender,12    };13  }14
15  get normalizedRatio(): { ascender: number; base: number; descender: number } {16    const normalizationFactor = 1 / this.#config.ratioBase;17    return {18      ascender: this.#config.ratioAscender * normalizationFactor,19      base: 1,20      descender: this.#config.ratioDescender * normalizationFactor,21    };22  }23
24  // [...]25  private addCalligraphyLines(): string {26    let gridParent = this.createGroup('grid','calli-grid',this.maskId ? this.maskId : undefined,);27    const buffer = this.#config.addAreaBox ? this.#config.areaBlockBuffer : 0;28    const height = this.gridHeight - buffer * 2;29    const lineReps = Math.floor(height / this.lineHeight);30    const lineGap = (height - lineReps * this.lineHeight) / (lineReps - 1);31    let yLineStart = this.marginTop + buffer;32
33    for (let i = 0; i < lineReps; i++) {34      const line = this.addCalligraphyLine(yLineStart,this.marginLeft,this.width - this.marginRight);35      gridParent += line;36      yLineStart += this.lineHeight + lineGap;37    }38
39    gridParent += '</g>';40
41    return gridParent;42  }43
44  private addCalligraphyLine(gridPos: number,lineStart: number,lineEnd: number): Element | string {45    const {46      ascender: normalizedAscender,47      base: normalizedBase,48      descender: normalizedDescender,49    } = this.normalizedRatio;50    const gridPosAscenderLine = gridPos;51    const gridPosXHeightLine = gridPosAscenderLine + this.xHeight * normalizedAscender;52    const gridPosBaseLine = gridPosXHeightLine + this.xHeight * normalizedBase;53    const gridPosDescenderLine = gridPosBaseLine + this.xHeight * normalizedDescender;54
55    let lineGroup = this.createGroup('line');56    const ascender = this.addLineSection('ascender',gridPosAscenderLine,lineStart,lineEnd,'down');57    lineGroup += ascender;58    const base = this.addLineSection('base',gridPosBaseLine,lineStart,lineEnd,'up');59    lineGroup += base;60    const descender = this.addLineSection('descender',gridPosDescenderLine,lineStart,lineEnd,'up');61    lineGroup += descender;62    if (this.#config.slantAngle > 0) {63      const slantLines = this.addSlantLines(gridPosDescenderLine, lineStart);64      lineGroup += slantLines;65    }66    lineGroup += '</g>';67    return lineGroup;68  }69
70  private addSlantLines(gridPos: number, lineStart: number): string {71    let slantGroup = this.createGroup('slant-lines');72    const reps = this.#config.slantLinesPerLine;73    const endPosXFinalLine = this.gridWidth;74    const startPosXFinalLine = endPosXFinalLine - this.lineHeight / Math.tan((this.#config.slantAngle * Math.PI) / 180);75    const totalWidth = startPosXFinalLine;76    const spaceBetweenRepetitions = totalWidth / (reps - 1);77    let startPosX = lineStart;78    for (let i = 0; i < reps; i++) {79      const slantLine = this.drawSlantLine(this.lineHeight,this.#config.slantAngle,startPosX,gridPos,this.#config.lineColor,this.#config.gridStrokeWidth);80      slantGroup += slantLine;81      startPosX += spaceBetweenRepetitions;82    }83    slantGroup += '</g>';84    return slantGroup;85  }86
87  private addLineSection(section: 'ascender' | 'base' | 'descender',gridPosLine: number,lineStart: number,lineEnd: number,dividerDrawingDirection: 'down' | 'up'): Element | string {88    const ratios = this.ratio;89    const dividerGap = this.xHeight / ratios['base'];90    const ratio = ratios[section];91    const color = this.#config.lineColor;92    const stroke = this.#config.gridStrokeWidth;93    let group = this.createGroup(section);94    const gridPosXHeightLine = gridPosLine - this.xHeight;95    const gridPos = section !== 'base' ? gridPosLine : gridPosXHeightLine;96    const line1 = this.drawSolidLine('horizontal',gridPos,lineStart,lineEnd,color,stroke);97    group += line1;98    /**99     * the base section includes the x-Height Line (first solid line, and then additionally a thicker baseline)100     * and optionally a vertical xHeight Indicator101     */102    if (section === 'base') {103      const baseLine = this.drawSolidLine('horizontal',gridPosLine,lineStart,lineEnd,color,this.#config.gridBaseLineStrokeWidth);104      group += baseLine;105      if (this.#config.showXHeightIndicator) {106        const xHeightIndicator = this.drawSolidLine('vertical',lineStart + this.#config.xHeightIndicatorStrokeWidth * 0.5,gridPosXHeightLine,gridPosLine,color,this.#config.xHeightIndicatorStrokeWidth);107        group += xHeightIndicator;108      }109    }110    if (this.#config.addDividerLines) {111      for (let i = 1; i < ratio; i++) {112        const gap = dividerDrawingDirection == 'down' ? dividerGap : dividerGap * -1;113        const gridPos = gridPosLine + i * gap;114        const dotRadius = this.#config.gridStrokeWidth;115        const divider = this.drawDashedLine('horizontal',gridPos,lineStart,lineEnd,dotRadius,color);116        group += divider;117      }118    }119    group += '</g>';120    return group;121  }122}
Variations
VariationsTo see how flexible it is, here are a few examples that show off the different settings.
Spencerian Style grid
Spencerian Style gridCalligraphy Line Grid
3:1:3 ratio, 52 degree slant, 8 slant lines per line
For the Crazy People
For the Crazy PeopleYes, you can do grids with no slant lines too…
Try It Out
Try It OutIn the end, I also made a generator, because I wanted to be able to make this accessible to non-coders too.
You can play with it in the preview below, of go to the site and use it there.
Bookmark it, use it, tell me if you like it. I’m open to feedback and suggestions if anything is missing.
Wrap Up
Wrap UpI had a lot of fun with this project and I learned a lot about SVG and how to make it more efficient and how to make it work with Affinity Designer.
It was a bit of a math odyssey at times, but I am very happy with the end result.